Big-screen station (ST7789 2.8″)
The bench’s flagship screen: a 240×320 IPS panel showing live weather, a UTC clock, and a three-ticker market board at once, all fetched from the sandbox internet over real DNS + TCP sockets. A full frame is 150 KB — bigger than the MicroPython heap likes — so it paints in eight 240×40 strips, each blitted into its own CASET/RASET window: the exact technique real firmware uses when the panel outgrows RAM.
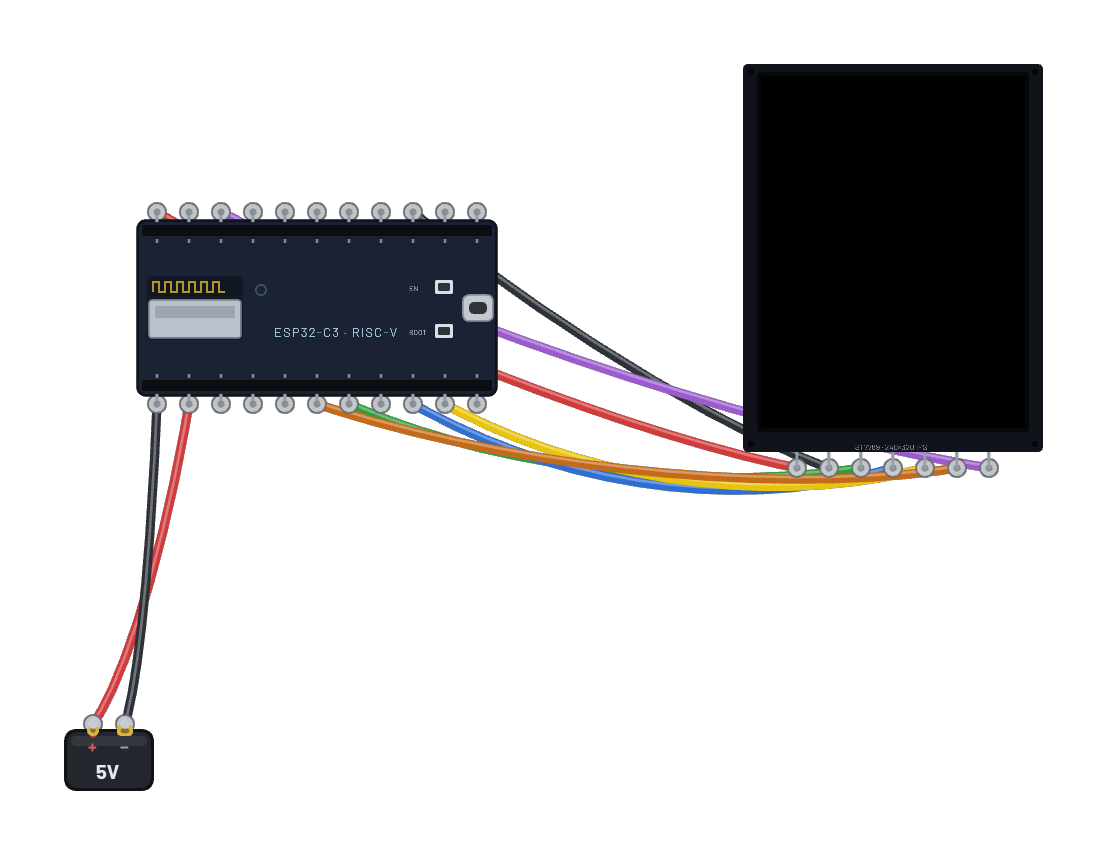
How it works
The bench's biggest screen, driven the honest way. A 240×320 ST7789 speaks the same ST77xx command set as the little 1.8″ TFT — CASET/RASET address windows, RAMWR pixel bursts, RGB565 big-endian — but a full frame is 150 KB, more than MicroPython wants to allocate in one piece. So the script owns a single 240×40 strip buffer (19 KB) and paints the screen as eight horizontal bands: header with a live UTC clock, weather card, a markets divider, one stock quote per band, footer. Each band is drawn into the strip framebuf, then blitted into its own CASET/RASET window — the exact technique real firmware uses when a panel outgrows RAM. The data is three genuine sandbox-internet fetches per refresh (api.weather.test, worldtimeapi.test, api.stocks.test) over real DNS + TCP sockets.
What's on the bench
- Battery
- ESP32-C6
- TFT 2.8″ 240×320 (ST7789)
How it's wired
- Battery · pos→ESP32-C6 · vin
- Battery · neg→ESP32-C6 · gnd
- ESP32-C6 · 3v3→TFT 2.8″ 240×320 (ST7789) · vcc
- ESP32-C6 · gnd2→TFT 2.8″ 240×320 (ST7789) · gnd
- ESP32-C6 · g7→TFT 2.8″ 240×320 (ST7789) · din
- ESP32-C6 · g6→TFT 2.8″ 240×320 (ST7789) · clk
- ESP32-C6 · g5→TFT 2.8″ 240×320 (ST7789) · cs
- ESP32-C6 · g3→TFT 2.8″ 240×320 (ST7789) · dc
- ESP32-C6 · g4→TFT 2.8″ 240×320 (ST7789) · rst
The code
This MicroPython script runs on the emulated board every boot; edit it in the Code tab.
# Big-screen station: 240x320 ST7789 painted in 240x40 strips (a full
# frame is 150 KB - bigger than the heap, so we render band by band).
from machine import Pin, SPI
import framebuf, time, network, socket, json
W, H, STRIP = 240, 320, 40
# Hardware SPI (GPSPI2) on the C6 fixed pins: sck=6, mosi=7.
spi = SPI(1, baudrate=20000000)
dc = Pin(3, Pin.OUT); cs = Pin(5, Pin.OUT, value=1); rst = Pin(4, Pin.OUT)
def wr(c, d=None):
    cs(0); dc(0); spi.write(bytes([c]))
    if d is not None:
        dc(1); spi.write(bytes(d))
    cs(1)
rst(0); time.sleep_ms(20); rst(1); time.sleep_ms(50)
wr(0x01); time.sleep_ms(120)          # SWRESET
wr(0x11); time.sleep_ms(120)          # SLPOUT
wr(0x3A, [0x05])                       # COLMOD 16-bit RGB565
wr(0x36, [0x00])                       # MADCTL: portrait 240x320
wr(0x29)                               # DISPON
buf = bytearray(W * STRIP * 2)
fb = framebuf.FrameBuffer(buf, W, STRIP, framebuf.RGB565)
def rgb(r, g, b):
    # framebuf stores RGB565 little-endian, the ST77xx wire wants
    # big-endian - swap once here so colors land right.
    v = ((r & 0xF8) << 8) | ((g & 0xFC) << 3) | (b >> 3)
    return ((v & 0xFF) << 8) | (v >> 8)
def blit(y0):
    # Push the strip into its own address window, then RAMWR the bytes.
    wr(0x2A, [0, 0, (W - 1) >> 8, (W - 1) & 0xFF])
    wr(0x2B, [y0 >> 8, y0 & 0xFF, (y0 + STRIP - 1) >> 8, (y0 + STRIP - 1) & 0xFF])
    cs(0); dc(0); spi.write(bytes([0x2C])); dc(1); spi.write(buf); cs(1)
w = network.WLAN(network.STA_IF); w.active(True)
w.connect('BreadboardNet')
while not w.isconnected():
    time.sleep_ms(100)
def fetch(host, path):
    addr = socket.getaddrinfo(host, 80)[0][-1]
    s = socket.socket(); s.connect(addr)
    s.send(('GET ' + path + ' HTTP/1.0\r\nHost: ' + host + '\r\n\r\n').encode())
    r = b''
    while True:
        c = s.recv(256)
        if not c: break
        r += c
    s.close()
    return json.loads(r.split(b'\r\n\r\n', 1)[1])
BG = rgb(12, 16, 24); BAND = rgb(22, 30, 44); EDGE = rgb(70, 110, 180)
CYAN = rgb(120, 200, 255); GREEN = rgb(110, 230, 140); RED = rgb(240, 110, 100)
YELLOW = rgb(235, 210, 90); WHITE = 0xFFFF
n = 0
while True:
    wx = fetch('api.weather.test', '/weather')
    tm = fetch('worldtimeapi.test', '/time')
    qs = fetch('api.stocks.test', '/stocks')['quotes']
    n += 1
    # strip 0: header band with the live UTC clock
    fb.fill(BAND)
    fb.text('BREADBOARD STATION', 48, 8, CYAN)
    fb.text(tm['utc_datetime'][11:19] + ' UTC', 76, 24, WHITE)
    fb.hline(0, 39, W, EDGE)
    blit(0)
    # strip 1: where + sky
    fb.fill(BG)
    fb.text(wx['location'][:26], 16, 8, WHITE)
    fb.text(wx['conditions'][:26], 16, 24, CYAN)
    blit(STRIP)
    # strip 2: the headline numbers
    fb.fill(BG)
    fb.text('TEMP  %s C' % wx['temperature_c'], 16, 8, GREEN)
    fb.text('HUMIDITY  %d %%' % wx['humidity'], 16, 24, YELLOW)
    blit(2 * STRIP)
    # strip 3: markets divider
    fb.fill(BAND)
    fb.text('MARKETS', 88, 16, CYAN)
    fb.hline(0, 0, W, EDGE); fb.hline(0, 39, W, EDGE)
    blit(3 * STRIP)
    # strips 4-6: one quote per band, red/green by direction
    for i in range(3):
        fb.fill(BG)
        if i < len(qs):
            q = qs[i]
            col = GREEN if q['change'] >= 0 else RED
            fb.text(q['symbol'], 16, 12, WHITE)
            fb.text('%s' % q['price'], 96, 12, col)
            fb.text('%+.2f' % q['change'], 168, 12, col)
        blit((4 + i) * STRIP)
    # strip 7: footer
    fb.fill(BG)
    fb.hline(0, 0, W, EDGE)
    fb.text('refresh #%d  every 2s' % n, 16, 16, rgb(150, 160, 175))
    blit(7 * STRIP)
    print('station drew frame', n, '-', wx['temperature_c'], 'C,', len(qs), 'quotes')
    time.sleep_ms(2000)
Try this
- Watch the clock band: every 2-second refresh repaints all eight strips with fresh fetches.
- Make a quote band taller: change STRIP to 64 and the loop to five bands — the CASET/RASET math is the whole lesson.
- Open the 📡 Sniffer during a refresh: three HTTP round trips, then the long SPI burst as 8 strips stream out.
- Point a band at /api or /echo instead of stocks and design your own dashboard row.